POWER BI

Microsoft Power BI

ARE YOU A DATA DRIVEN ORGANISATION?

Contact Us to find out how you can place Business Intelligence at the centre of your decision making

What is Power BI?

Power BI is a data visualisation tool helping business users to leverage their data to make better decisions. It is truly democratising Business Intelligence.

For the data nerds among us, it’s the successor to 'Power BI for Office 365' and through Excel, encompasses Power Query, Power Pivot, and Power View. Because it was originally an add-on to other Microsoft products, Power BI has familiar and intuitive UI and it won’t be long before you are creating dashboards like a pro.

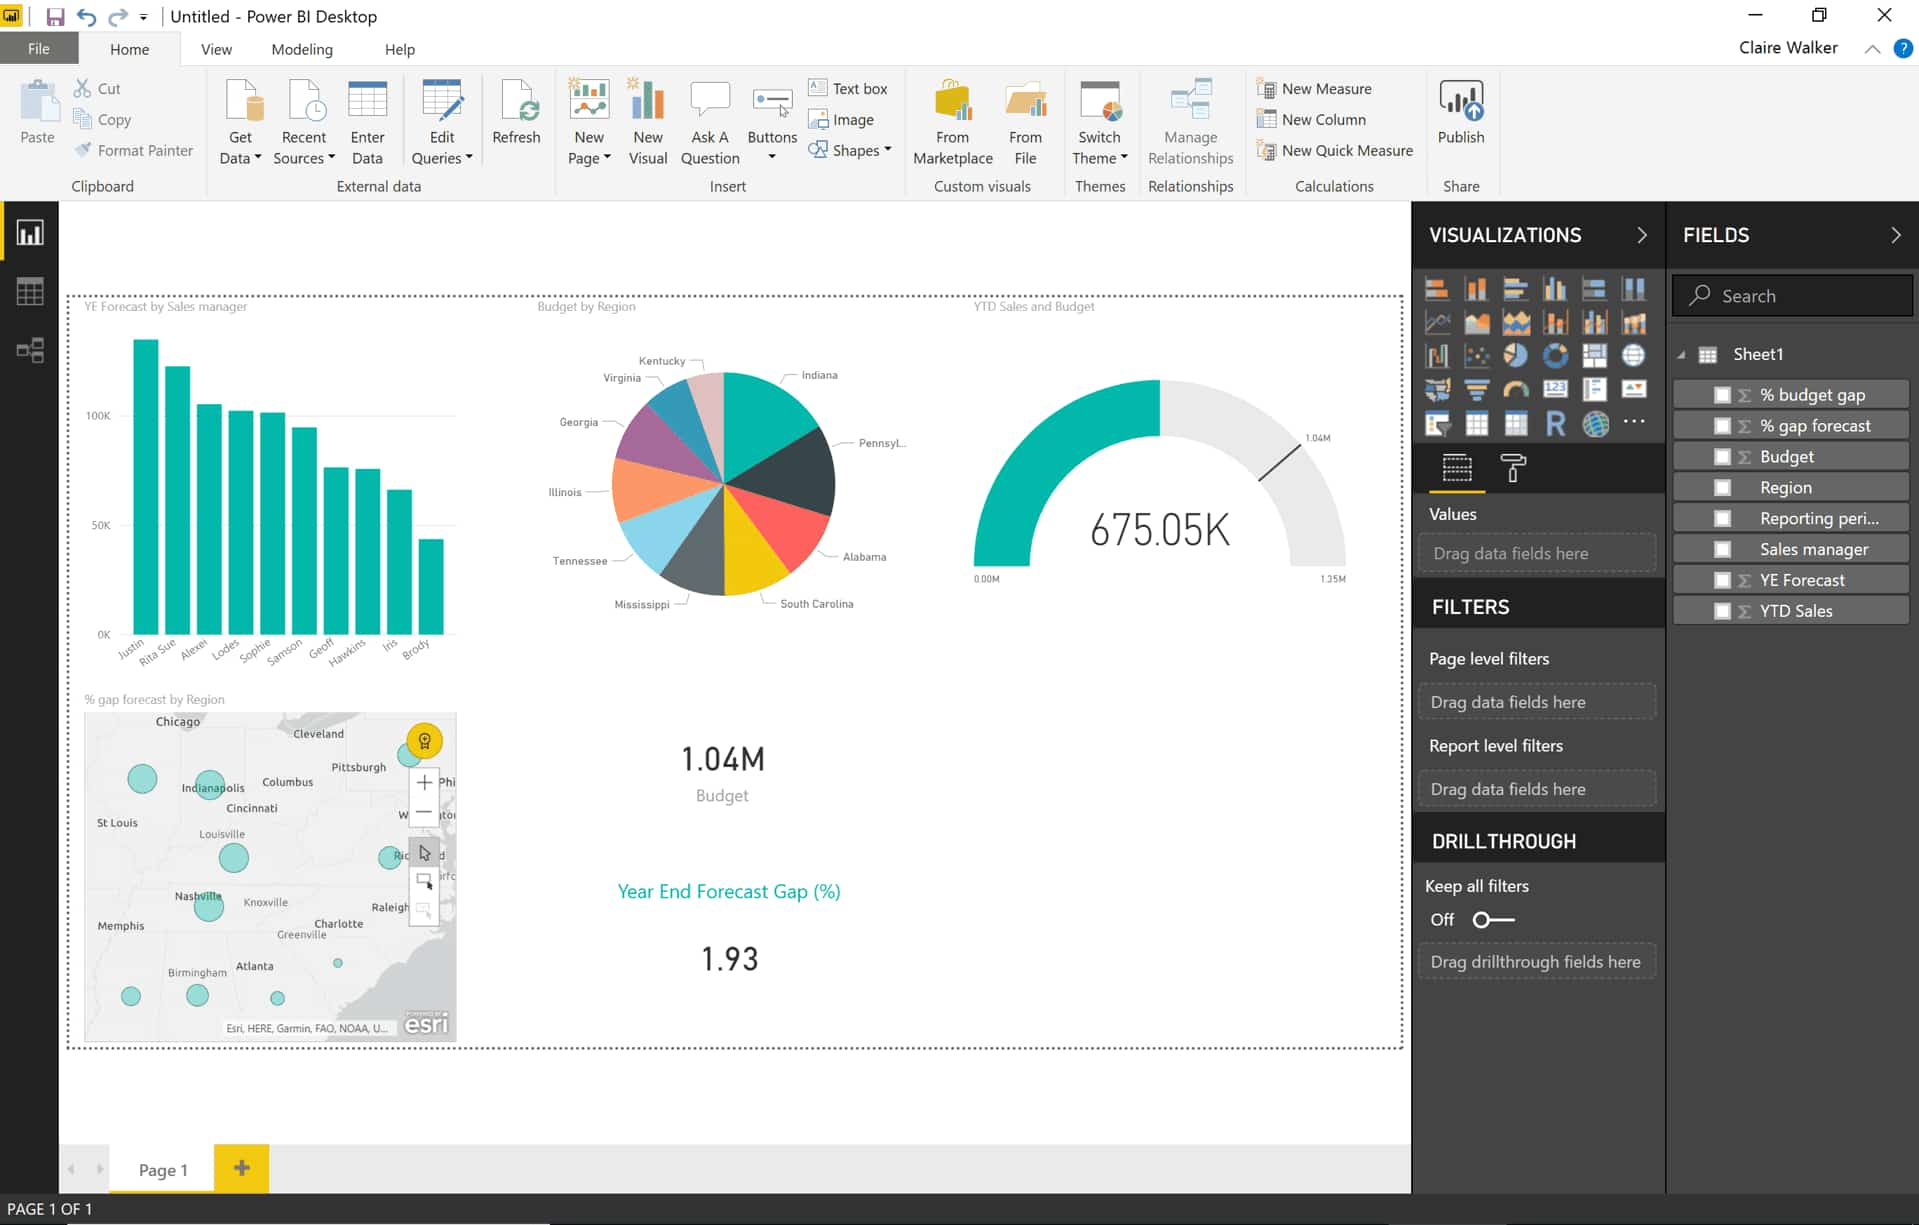
Power BI can work across different sources of information such as event attendance lists, sales reports, CRM or website stats to turn this:

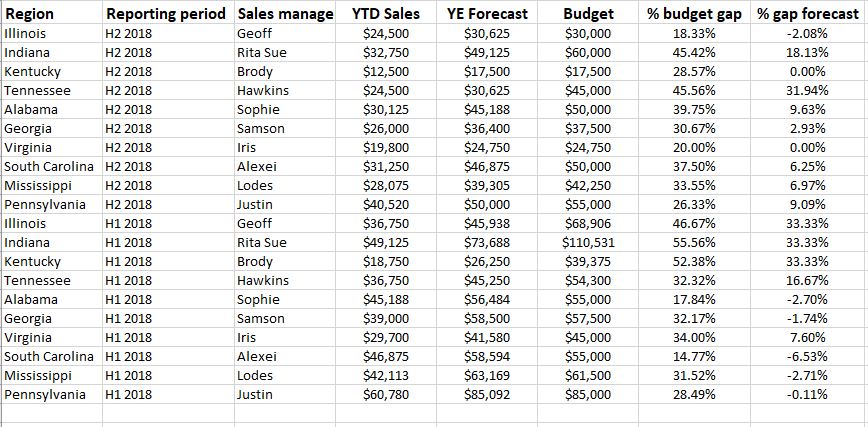
Power BI can work with structured data like the example above, or unstructured such as blogs, videos, images and meeting minutes, from on-premises and the cloud. Data connectors let you point your BI tool at a particular app or data set and incorporate that data into your queries.

The service can pull multiple data sources into one view to provide a handy overview of sales, customer complaints, intranet engagement, social marketing outcomes or nearly anything else for which you have raw data.

The challenge is often in formatting and connecting the data source which is where WebVine can help.

CREATE WITH Power BI Desktop:

where you create models and dashboards. You can download the free desktop version here. https://powerbi.microsoft.com/en-us/desktop/

ACCESS ON THE GO WITH Power BI mobile app:

an app you have to download to your phone that allows access to data, check stats and even set alerts from your smartphone. This can be real-time depending on your level of licence.

PUBLISH WITH PowerBI.com (Service):

a cloud service where you publish for sharing and collaboration.

RAMP IT UP WITH Power BI Premium:

provides greater capacity and more features for enterprise users with large data sets.

ARE YOU A DATA DRIVEN ORGANISATION?

Contact Us to find out how you can place Business Intelligence at the centre of your decision making

How do I use Power BI?

1. Set up an account

in Power BI – both you and anyone with whom you wish to share information must have an account.

2. Download

Power BI desktop

3. Import your data

from CSV, Excel or other formats. You can edit the data at this point if you need to.

4. Create reports

in Power BI Desktop by selecting fields and visualisation type.

5. Publish

to the Power BI Service – you will get a link to access your report in your web browser

6. Create a dashboard

you can’t share reports, only dashboards.

7. Share the report

with your team by clicking on the Share button and nominating recipients

8. Interrogate

the data using natural language queries like How many sales people are meeting targets?

9. Bask in the glory

of real time business insights

Data made beautiful

A Dashboard is a collection of reports that provides an overview of one aspect of your business: sales, logistics, customer management or manufacturing output. Each report is called a Tile and represents one data set.

Dashboards aren’t just pretty pictures; they are interactive and customisable and the tiles update as the underlying data changes.

There is no need to reinvent the wheel. Microsoft provide a range of template visualisation formats. If you get bored with those, there are also free custom visualisations in the Office Store, including but not limited to ͞aquarium, dot plot, pulse chart and bubble chart. Fun!

Note Dashboards are not available in Power BI Desktop, neither can they be created on mobile devices but they can be viewed and shared on mobile.

Power your BI with WebVine

From logistics to staff engagement to price optimisation to sales conversion, there is no aspect of business that does not benefit from democratised, digestible information, available real time and on the go.

There is no need to hire an expensive data analytics agency to take control of your information.

We can help you leverage your valuable data, enhancing business decisions through visualisation, data modelling and workflows.

Having trouble with your data sources? Let us help with your data prep and system connections.

Microsoft created this case study about a WebVine project with iconic Australian manufacturer Redback Boots, using Power BI and Dynamics 365 to drive global sales.

This 30-minute webinar introduces Power BI as a tool to better understand your intranet users and measure ROI.

Contact Us

Take the first step to becoming a data driven organisation.
Complete the form below to discuss your Business Intelligence needs.